

Intro
Every incident response analyst has been there: the further an investigation progresses, the more evidence has quietly disappeared. Windows event logs roll over. The USN journal doesn’t reach far enough back. And it’s rarely just those two. The catch is that by the time the investigation points you at the artifact that matters, some of it is already gone.
That’s why we believe in preserving the most valuable evidence at the start of an engagement. But you can’t just run a Velociraptor hunt that pulls raw artifacts from hundreds of endpoints back to the Velociraptor server. That pushes it past what it was built for, which is querying live endpoints – and for that it’s hard to beat!
We wanted to preserve all of it up front and analyse it at scale: years of activity from every endpoint in one place, so the questions that drive an investigation (how they got in, where they moved, what they took) are a single query away.
That’s why we built Cycas. It ingests everything from Velociraptor into tables in an Azure Data Explorer (ADX) cluster, whether it’s raw artifacts collected from 500 endpoints or hunt results from 50,000 endpoints, run from the Velociraptor server. All ingested data is queryable with Kusto Query Language (KQL), across every host at once.
What Cycas is
Cycas is an open-source DFIR platform that turns everything you collect with Velociraptor into one Azure Data Explorer (ADX) database that you can query. It combines three parts, each doing what it’s best at:
- Velociraptor collects. It gathers mass triage packages from every endpoint in scope at the start of an engagement, and runs live response and targeted hunts as the investigation develops.
- Azure Functions process. Every triage package is picked up as soon as it arrives and handled in parallel: raw artifacts such as the MFT, event logs and registry hives are parsed into structured data.
- Azure Data Explorer stores it for analysis. Everything lands in one ADX database, with one table per artifact and every record tied to the endpoint it came from, ready to query with KQL across all hosts at once.
Whether the data came from +1,000 triage packages collected on day one or a hunt run on day three, it ends up in the same tables.
A fresh DFIR platform in less than 20 minutes for every engagement
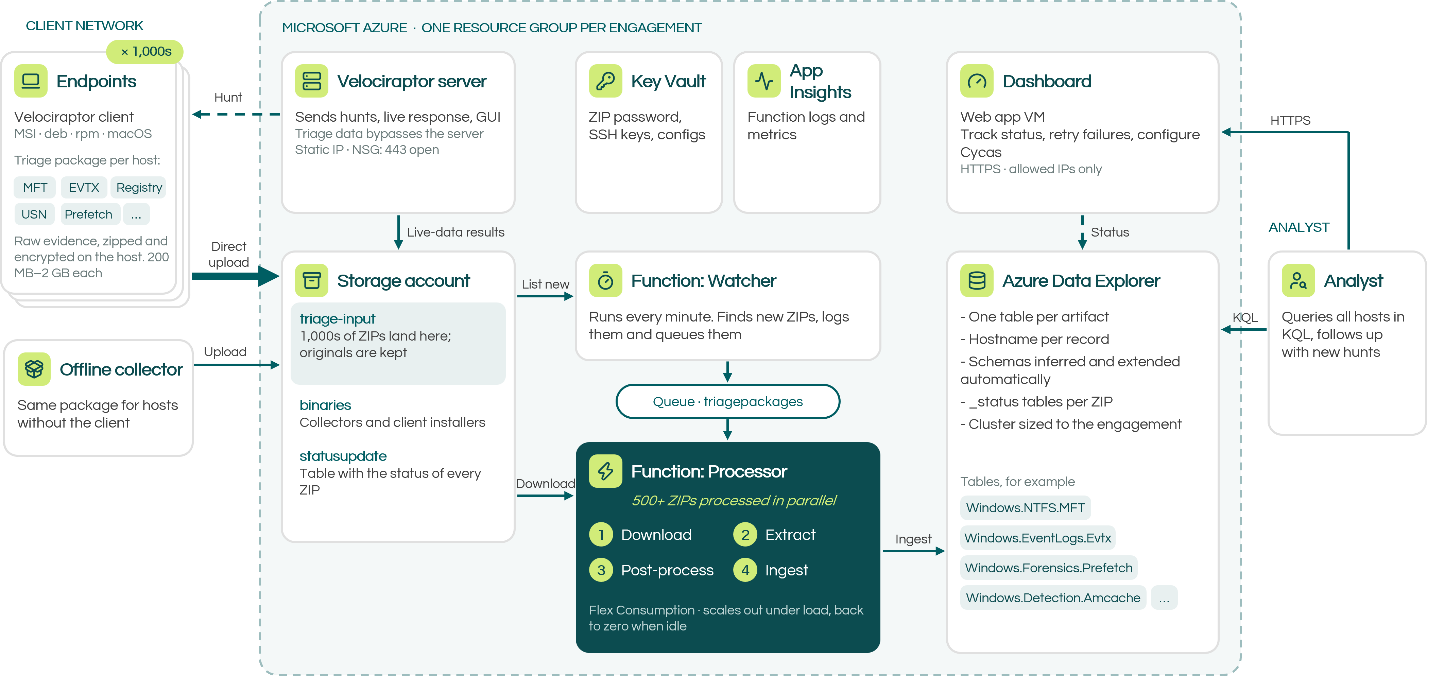
Every engagement at Nerium starts on a fresh Cycas environment, in a resource group of its own. Nothing is shared between cases, so data from a previous investigation can never end up in the current one. When the engagement is closed, you delete the resource group and everything in it goes with it.
That only works if setting it up is quick and easy. One command, python easy_install.py, asks a few questions (like the region) and builds the complete platform in about 15 minutes.
Here’s what you get, grouped by what each part does:
Collect
- A Velociraptor server on a VM with a static IP and a Let’s Encrypt certificate, ready for 1,000+ clients.
- Client installers for Windows (a standard and optionally an obfuscated MSI), Linux (deb and rpm) and macOS, built and ready to share with the customer.
- Offline collectors for Windows, Linux and macOS, for endpoints where the client can’t be installed.
- Prepared hunts: six small hunts for volatile live data (DNS cache, services, network connections, processes, Security event log and scheduled tasks), plus the mass triage collection that uploads straight from each endpoint to Cycas.
- New clients are labelled automatically as workstation, server, domain controller or Linux, so you can target hunts straight away.
Process
- A storage account with the input container, the processing queue and the status table.
- Two Azure Functions, the Watcher and the Processor, on a Flex Consumption plan that scales out under load and back to zero when idle. Application Insights monitors them.
Analyse
- An Azure Data Explorer cluster sized to the engagement: a dev cluster (about $2.40 a day when idle) for small cases or testing, or a production cluster for estate-wide incidents.
- The dashboard on its own VM, reachable over HTTPS from your IP addresses only.
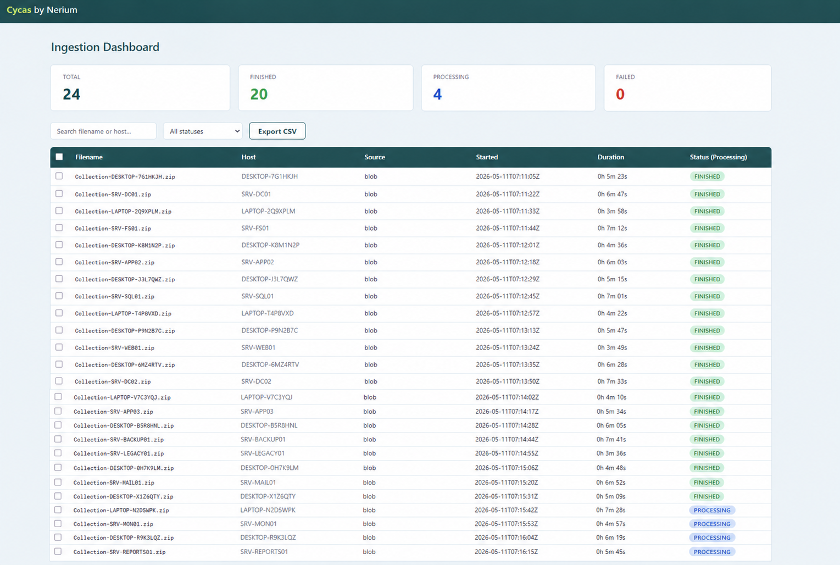
Dashboard
Cycas doesn’t require a dashboard to function, but it makes it easier to stay on top of things during an engagement. You can monitor processing status, re-run a failed upload, and configure Cycas through a UI. It’s an active part of development, more is coming.
How we use it at Nerium
When we kick off an incident response engagement, we typically ask the customer to deploy the Velociraptor client to all endpoints. Through the Velociraptor server we initiate a mass-data collection to upload straight from the endpoint to the blob, after which the collection is queued for ingesting into ADX.
We also use the Velociraptor server to initiate targeted hunts on endpoints, for example to hunt for webshells on IIS servers. To ensure that these results are also ingested into ADX, we configure the server to upload the results to the blob as well.
Velociraptor collection initiated via server, uploaded straight from endpoint to blob
For most engagements we enrol endpoints with the Velociraptor client and orchestrate the collection from the server. The forensic artifacts we collect this way are uploaded directly from the endpoint to the Azure Blob Storage. Meaning the data is not routed via the server. We prefer this as it is one less link in the chain. It’s not feasible to upload raw artifacts of +500 endpoints in parallel to the Velociraptor server. Uploading directly to Blob is.
Having the Velociraptor client installed is our default, because investigations rarely end after the first collection. Three days in, you find a suspicious binary that needs to be pulled for analysis for example. With the Velociraptor client still enrolled, you can collect it yourself, and there is no need to wait for the customer.
From Velociraptor server to Azure Data Explorer
We described ingesting data that were collected straight from the endpoint to blob.But what about ingesting Velociraptor hunting results that are stored on the Velociraptor server? It makes sense to have all the investigation data there as well, as Azure Data Explorer is more suitable in querying large amounts of structured data as opposed to Velociraptor.
Currently it’s one click away to ingest into Azure Data Explorer using Cycas. The instructions are found here in our documentation. It ingests it into new or existing tables that matches the Velociraptor artifact name, and the schema is mapped automatically.
Philipp Leu at baseVISION took another approach and recently developed a Velociraptor plugin for this. We tested it and it works well. It requires a service principal and you need to manually map KQL to the Velociraptor schema.
500 endpoints processed in Y minutes
Cycas can process triage data in concurrence by taking advantage of the cloud scaling possibilities using Azure Functions.
Total speed
500 endpoints is a realistic scope for a mid-size incident. We processed the full triage dataset – 500 ZIP files each 2 GB of (raw) forensic artifacts – in Y minutes. By the time you’re ready to investigate, the data is already waiting to be queried.
Azure cost
The total cost for ingesting 500 collection packages (1.1 GB each) and leaving the cluster* running for 1 month, is ~$135. As the ADX cluster is the costliest, you can save massively by turning the cluster off. For example, if you only leave the cluster running for one week and turn off the rest of the month, the cost is ~$35.
The ADX cluster is roughly 80% of the Azure bill, but if you turn it off
- 65 triage packages per hour with dev cluster
* The cost is based on the most basic cluster: ‘Dev(No SLA)_Standard_E2a_v4’
How we secured it
A DFIR platform holds sensitive data an organisation has: its filesystems, event logs and user activity. So security wasn’t something we added at the end.
Isolated per engagement. Each engagement gets its own resource group. Nothing is shared between cases, and deleting the resource group removes everything at once.
Encrypted from the endpoint onwards. Triage packages are password-protected on the endpoint, so they stay encrypted on the way to Azure and while stored there. Endpoints upload with a write-only link: they can add packages but never read or delete them.
No secrets lying around. Passwords, SSH keys and the Velociraptor configuration are kept in Key Vault. Each component signs in with its own managed identity and gets only the permissions it needs.
Minimal attack surface. Only the port the Velociraptor clients connect to is open to the internet. The GUI, the dashboard and SSH are open only to IP addresses you specify.
Hard to spot on the endpoint. An optional obfuscated client, with a different name, icon and file properties, makes it harder for an active attacker to recognise. It raises the bar but doesn’t make the client invisible. You can find more about how we do this here.
Years of development (in-between incidents)
Cycas started as an internal tool built by incident responders to ensure we could quickly analyse data using our favourite query language ‘KQL’. We knew quickly enough that we wanted investigation data in an Azure Data Explorer Cluster, because it supports KQL and pricing is based on pay-per-use, meaning you don’t have to pay for an expensive license upfront.
Why Velociraptor?
We also knew quickly enough that we wanted to ingest investigation data from our favourite incident response tool ‘Velociraptor’ into Azure Data Explorer. It is a powerful tool that we deploy on most endpoints during an engagement (in a few cases even up to 60,000). As it supports live response, our analysts can collect relevant forensic artifacts from all those systems for investigation purposes.
One tool, one schema
We made a deliberate choice to build Cycas around Velociraptor only. Supporting additional collection tools would mean having to let the analyst deal with multiple tables for the same artifact with different schemas.
This created a new problem as we wanted Cycas to parse raw artifacts that were already collected – for example, by another team. But Velociraptor isn’t designed for that. It excels at collecting and processing artifacts from live endpoints, not at parsing artifacts that already exist as files.
Parsing raw artifacts collected to a ZIP file
We solved this with Velociraptor’s remapping feature, which lets you point Velociraptor’s accessors at files on disk instead of a live endpoint. To make this work automatically, we built Custom.Generic.Utils.ZipRemap – an artifact that inspects a triage ZIP and dynamically generates the remapping configuration for it. It locates the MFT on each drive, the registry hives, every user’s NTUSER.DAT and UsrClass.dat, and the Amcache hive, and maps each of them to the correct accessor. Velociraptor then runs as if it were querying a live endpoint, but it’s reading directly from the collected ZIP.
Some standard Velociraptor artifacts still needed adjustments to work correctly against remapped, offline data rather than a live endpoint. We maintain these as custom variants (Custom.Windows.*) alongside the standard set.
How we made it fast – Compute that scales with the incident
Most data pipelines are built around a steady stream of data arriving over time. Cycas is built for the opposite: at the start of an engagement, 100 to 2,000 triage packages land in Blob Storage within minutes of each other. The bulk of the data comes in one go, and it needs to be processed and query-able just as fast.
Handling that kind of burst means scaling out fast, processing everything in parallel, and scaling back down just as quickly. That’s where Azure Functions come in. We experimented with three Azure Functions plans: Consumption, Flex Consumption, and Premium. Flex Consumption gave us the fastest scale-out of the three, without the always-on cost of Premium or the maximum time limitation of standard Consumption.
Tying every record to its endpoint
Every record in Azure Data Explorer needs to be tied to the endpoint it came from. Cycas adds three columns to every record it ingests:
- cycas_hostname: the endpoint the data came from
- cycas_sourcezip: the triage package the record came from
- cycas_uploadid: the processing run, which links the record to the _status tables in ADX
These columns are always placed at the end of the table, so they never get in the way of the artifact’s own fields.
Cycas looks up the hostname once per triage package, before any processing starts. First it reads client_info.json, the file in which Velociraptor records details about the client in each collection. This is quick, because only that one small file needs to be extracted. If the file is missing or unreadable, Cycas falls back to the registry: it uses Velociraptor’s remapping to read the computer name from the SYSTEM hive inside the ZIP.
Automatic schema detection
Every artifact brings its own set of fields, and new Velociraptor collections can introduce columns Cycas has never seen before. Hand-writing and maintaining ADX table schemas for each of these would be a losing battle, so Cycas figures it out for you.
Cycas samples incoming records and infers the right ADX type per column: timestamps (ISO-8601 or epoch) become datetime for time-based KQL queries, numbers become long or real, nested JSON becomes dynamic for mv-expand/bag_unpack, and everything else falls back to string.
If a table already exists and new data introduces fields that weren’t there before, Cycas extends the schema automatically.
Why we open-sourced it
Cycas started as an internal tool. Something we built to solve our own problems on engagements. It wasn’t designed to be a product.
After three years, many improvement cycles, and real incident response and compromise assessments later, we decided to open-source it and work on an easy installer and a webapp to make it accessible for the community to use it. We open-sourced it because we believe better tooling makes the whole community more effective (which ultimately helps organisations to recover quicker!).
How to get started
Cycas is open-source and free to use. The documentation covers everything from a one-command easy installation to a full manual setup for existing Azure environments.
If you run into issues or have ideas for improvement, feel free to open an issue on GitHub.